The axial slices of high-resolution lemon images (a, b, c) and in-vivo rat brain images (d, e, f) acquired with FLASH (a, d), GE-EPI (b, e), and RASE (c, f).

Arterial Input Function(AIF)
Experimental results of the Gd-doped phantom imaging (a, b) and DCE imaging of mice in the kidney (c, d) obtained with RASE and 2D FLASH. a: The results obtained from RASE and FLASH were plotted with red and blue circled solid lines, respectively. By virtue of the reduced susceptibility-induced signal loss due to the quadratic-phase encoding, RASE provided higher signal enhancements than FLASH, showing a stronger positive linear correlation between signal intensity and Gd-concentration. b: The estimated Gd-concentrations from RASE agreed well with the expected Gd-concentrations (red solid line), as well as the ones estimated directly from T1 measurement as a standard reference (black solid line). In contrast, the estimated Gd-concentrations from FLASH increasingly deviated from their expected ones as the Gd-concentration increased (blue solid line). c: The arterial input functions (AIF) at the mouse kidney-feeding artery were obtained from RASE at the injection doses of 0.1, 0.2, and 0.3 mmol/kg as blue, green, and red solid lines, respectively. The subfigure shows the artery region (pointed to by a white arrow) 40 seconds after the injection. d: Peak concentrations of the AIFs were separately plotted for better representation, showing a strong positive linear correlation with the injection dose (r2 = 0.97, P < 0.001).
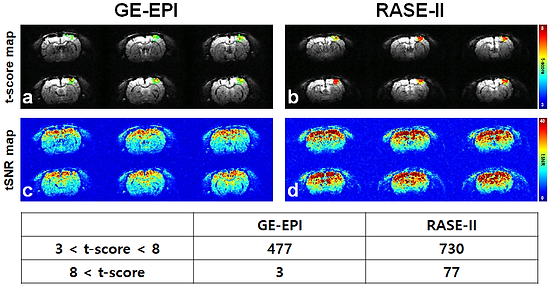
t-score and tSNR maps for GE-EPI (a, c) and RASE-II (b, d) on the somatosensory area of in-vivo rat brain. The top row shows t-score maps of BOLD activation in the range between 3 and 8 (a, b). The second row shows tSNR maps for the baseline volumes in the range between 0 and 40 (c, d). The table in the bottom row summarizes the number of activated voxels with t-scores in the range between 3 and 8, above 8. The maximum t-score of GE-EPI and RASE-II was 9.05 and 11.65, respectively.